Professional Online Portfolio
443-852-4675
Trojan Airlines: Passenger Aircraft Design
Objective
Develop a conceptual and preliminary design for a passenger airliner optimized to fly passengers on a route which includes schools in the BIG10 athletic conference for USC Athletics' aircraft fleet (Trojan Airlines).
Phase A
Perform a network analysis to identify most effecient routes to deliver passengers to all schools in the BIG 10. Determine conceptual design for all aircraft in the fleet

Phase B
Complete the preliminary design and optimization for one aircraft in the fleet to fly one of these routes
Phase A
Assumptions
-
Initial sizing for aircraft depended on range and passenger payload
-
Values such as Empty Weight Fraction (EWF) and Lift to Drag ration (L/D) were estimated from similar existing passenger aircraft
-
Overall, these helped provide sanity checks on design parameters
-
It takes approx. 10 years to develop a passenger jet, so estimations of technology 10 years in the future for EWF, L/D, and propulsion efficiency were made
-
All routes start and end at Los Angeles International Airport (LAX)


EWF Technology Advancement Estimation
-
Utilized EWF equation from historical data to predict future EWF
-
Assuming:
-
Jet transport values
-
Fixed sweep wing
-
-
In ten years, future aircraft EWF can be approximated as 95% of current EWF value
-
Cannot expect EWF to change much in ten years due to already high use of composites


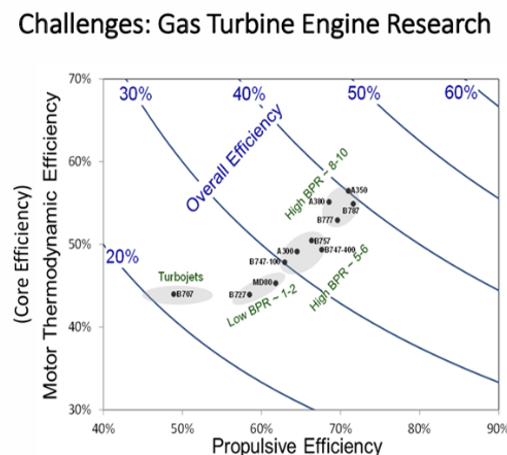
Propulsive Efficiency Technology Advancement Estimation
Assuming:
-
Current engines propulsive efficiency ~ 0.3 - 0.35
-
Newer engines w/ higher BPR projected efficiency > 0.4
-
Taking conservative approach for future estimation, choosing realistic values ranging from 0.35 - 0.4
-
Realistically, we cannot expect engines to change their efficiencies by a very large amount
L/D Technology Advancement Estimation
-
Similarly, L/D for the future plane was estimated using historical data shown to the right from Raymers Aircraft Design
-
L/D for the future aircraft was selected by improving the current L/D by roughly 20 %


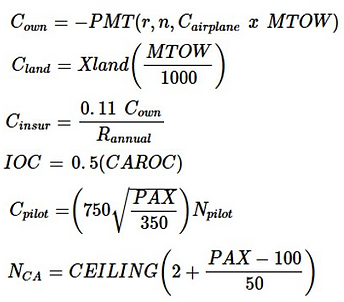

Design Models
For a passenger airliner, the most effecient routes are those that minimize operational costs and maximize profits
Various Excel spreadsheets were employed with the shown equations and graphs to determine each aircraft's range, payload, fuel consumption, and operating costs on each of their routes
Tools Utilized:
-
Mission sizer
-
Mission Executioner
-
Cost Model

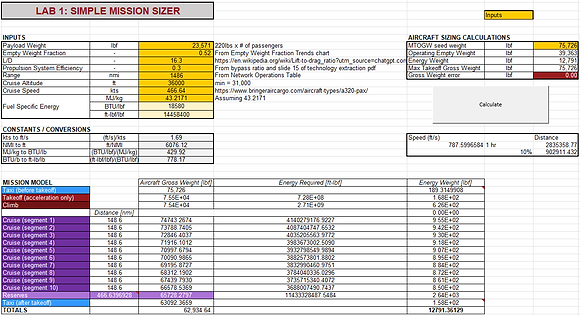
Mission Sizer
-
Estimates Max Take Off Weight (MTOW) from payload weight, Operating Empty Weight (OEW), and energy weight
-
L/D, propulsion efficiency, altitude, range, fuel specific energy are utilized to sum energy from each mission segment
-
Assumptions
-
Taxi Energy 0.25% of MTOW
-
Fuel Specific Energy = 18,580 BTU/lbf
-
Reserves = 10% of range
-
Payload = 220lbs * PAX / load factor
-
Load factor = 84%
-


Mission Execution
-
Creates payload-range curve to ensure aircraft can execute different missions within operating range
-
A = Zero fuel range (payload only, no fuel)
-
B = Max payload and fuel
-
C = Fuel volume limit (less payload, max fuel)
-
D = Ferry Range (No payload, max fuel only)
-
Same assumptions from mission sizer and sums energy from each mission segment
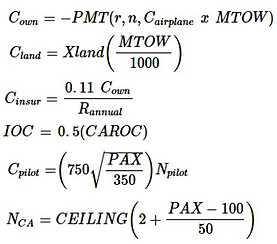
Cost Model
-
Compares Direct and Total Operating Costs of each aircraft to help determine financially viable aircraft
-
Assumptions:
-
20 yr loan lifespan
-
6% loan interest
-
Fuel = $3/gal
-
Maintenance = $1000/ block hr
-
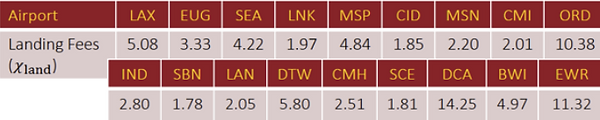
Free navigation fees (domestic)
-
Landing fees shown to the left
-
Optimization Approach
-
Objective: Design 5 aircraft that fit all route requirements
-
Initial-Optimization: Group all 17 initially designed aircraft into 5 ranges
-
0 - 1000 (nmi)
-
1000 -1400 (nmi)
-
1400 - 1600 (nmi)
-
1600 - 2000 (nmi)
-
2000+ (nmi)
-
-
Mid-Optimization: Regroup based off similar passengers per flight
-
Final Optimization: Combine into a single aircraft to travel max distance and carry max pax/flight from corresponding group
-
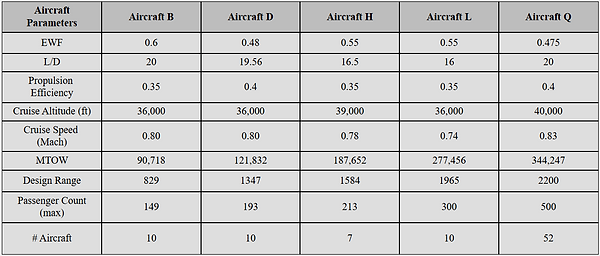
Based on this optimization process the following aircraft were designed
-
The Table right shows new range and passenger requirements for each aircraft

Fleet Design Target
-
From the parameters determined previously, it would be ideal for each aircraft to hit each of their design targets during the conceptual design in Phase B
-
Design targets were calculated from estimated technology advancements and assumptions
-
Fleet size (total number of aircraft) = 89
-
Number of distinct aircraft sizes = 5
Network Analysis
-
Finally a Network Analysis can be conducted along with the cost model to determine the Total Operating Cost (TOC) for the entire airline


Aircraft D Runway Length Verification
-
Estimated Take Off Field Length (TOFL) of aircraft is 7,500 ft
-
MTOW of designed aircraft is roughly 120,000 lbs
-
Airports served : LNK, MSP and CID
-
LNK Runway Length = 8,600 ft
-
LNK Max Landing Weight = 360,000 lbs
-
MSP Runway Length = 9,000 ft
-
MSP Max Landing Weight = 870,000 lbs
-
CID Runway Length = 8,000 ft
-
CID Max Landing Weight = 900,000 lbs
-
-
Aircraft will be able to take-off and land at airports serviced
Phase A Summary
-
Utilizing data from existing aircraft, technology advacement estimations, and mission/cost models I was able to determine the initial sizing for all aircraft in the Trojan Airlines fleet
-
Routes for each aircraft in the fleet were determined and optimized along with the TOC per day for the airline
-
I will only be designing Aircraft D in Phase B to meet the following design targets shown below

Phase B
Objective
Complete the preliminary design of a short to medium haul passenger airliner mission profile designed to operate routes between Los Angeles International Airport and Iowa City, Iowa, Madison, Wisconsin, and Champaign, Illinois while meeting design targets determined from Phase A.
Additional Requirements
-
Entry-into-service date set to 2035
-
(TOFL) meets mission requirements
-
Landing approach speed ≤ 145 knots at max landing weight
-
Initial cruise altitude ≥ 21,000 ft
-
Payload loading parameter of 0.15 used
-
Rigid static margin ≥ 10% MAC
-
No winglets used
-
Wing thickness-to-chord ratio within 0.062 ≤ t/c ≤ 0.15
-
Jet-A fuel with 18,580 BTU/lb used
-
Ultimate load factor of 3.75g assumed
-
Engine core efficiency selected between 0.40 and 0.60
-
MTOW is between 75,000 lb and 500,000 lb
-
Wingspan is less than 65 meters
-
Aircraft length is less than 74 meters
-
Maximum landing weight = weight at start of flight segment 10
-
Multhopp’s Method “Reduction factor” set to 0.4
-
Helical tip Mach ≤ 1.0 for the propulsor
-
Aircraft cost complexity factor set to 1.15
-
Structural advanced technology factor set to 0.9
-
Polar method used for drag calculation
-
Comply with FAA Crew Compartment Arrangement – 14 CFR §25.771 and §25.773
-
Comply with FAA Cabin Layout & Occupant Protection – 14 CFR §25.785 and §25.807 – §25.813
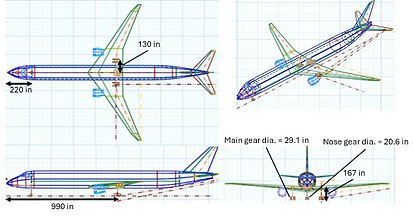
Fuselage Design
-
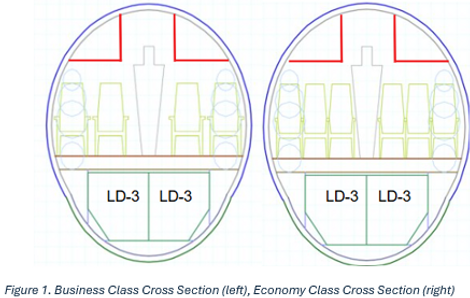
Passenger & Cargo Arrangement
-
Passenger seats placed on upper lobe for safety, comfort, and easy boarding.
-
Cargo stored in lower lobe for weight balance and efficient loading.
-
-
Fuselage Sizing & Seat Layout
-
Upper/lower lobe diameters sized primarily by economy class seating requirements.
-
Max 3 seats per side of aisle (no passenger crosses more than 2 seats).
-
Aisle sized for passengers + galley cart clearance.
-
Overhead bin headspace factored into upper lobe diameter.
-
Goal: minimize empty space while meeting comfort requirements.
-
-
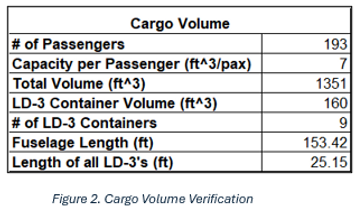
Cargo Section
-
Lower lobe sized for LD-3 containers (optimal geometry for space usage).
-
9 containers measured to fit within fuselage length while leaving room for landing gear & systems.
-
-
Tradeoffs in Fuselage Size
-
Wider fuselage = more seats + passenger comfort.
-
But increases drag, weight, wing/engine requirements, and affects nose, tail, landing gear placement.
-
-
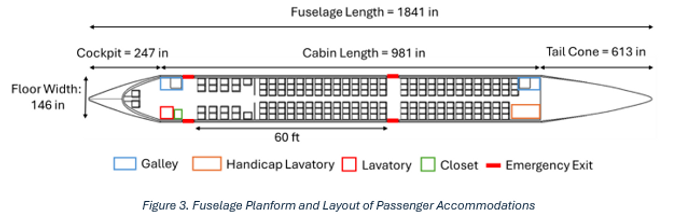
Cabin Layout & Features
-
15% of cabin dedicated to business class per design requirement.
-
Wheelchair lavatory + special seating placed at rear of business class.
-
Business class in front section of fuselage; economy in aft.
-
Galleys, lavatories, closets, crew stations, emergency exits arranged per Rawdon guidelines.
-
Emergency exits placed 60 ft apart; Type A doors selected based on passenger count.
-
Economy galley + handicap lavatory located at rear of fuselage.
-
Business class galley, lavatory, closet located at front to minimize wasted space.
-
-
Cockpit & Tail Section
-
Cockpit sized per Jetsizer bulkhead location, accommodates 2 pilots.
-
Cabin crew count ≤ 4 (based on cost model + flight time < 8 hours).
-
Pilot eye distance and seat position verified in CAD model.
-
Tail cone sized per 3:1 fineness ratio and 14° half-angle for aerodynamic efficiency.
-
Nose designed per L/D ratio for reduced drag, pilot visibility, and smooth airflow.
-
-
Structural Layout
-
Fuselage = cylindrical shell with frames (circular ribs) + stringers (longitudinal stiffeners).
-
Floors supported by beams separating passenger and cargo decks.
-
Design optimized for strength, weight, flexibility, and to withstand pressurization & flight loads.
-


Wing Design
-
Wing Geometry & Dimensions
-
Total wingspan sets lift and cruise efficiency; larger span = better aerodynamics but more structural weight.
-
Chord lengths, angles, and thickness optimized for high subsonic cruise (Mach 0.8).
-
Wing box thickness allows significant fuel volume and space for hydraulics, wiring, and structure.
-
Dimensions balance wing area (lift + fuel), weight, and aerodynamic smoothness.
-
-
High-Lift Devices & Control Surfaces
-
Leading-edge slats: 15% chord, multiple segments, gapped to avoid engine pylon interference.
-
Inboard flaps: 20% chord, positioned to avoid landing gear, require dedicated actuation.
-
Outboard flaps: 25% chord, with deployment mechanisms.
-
Ailerons: 20% chord, low deflection angles to avoid engine efflux.
-
Spoilers: placed between rear spar & control surfaces, share actuators for weight savings.
-
-
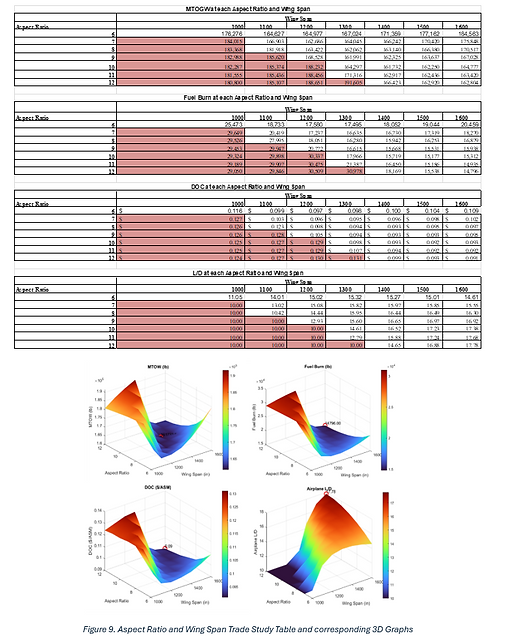
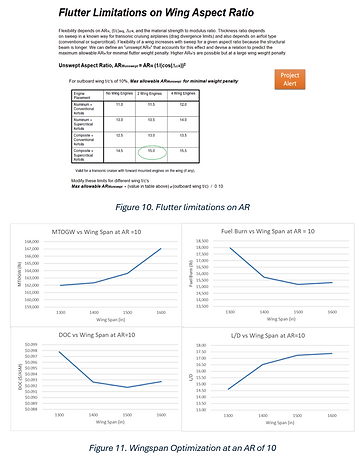
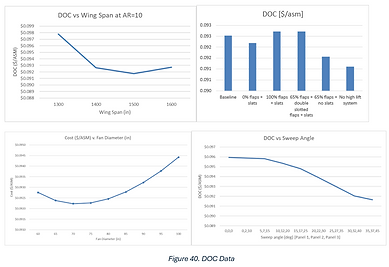
Wing Trade Studies
-
Compared aspect ratio (AR) vs. wingspan using MTOGW, fuel burn, DOC, and L/D ratio.
-
Maximum allowable AR unswept = 15 (flutter-limited); AR chosen = 10.
-
Optimal wingspan found to be 1500 inches:
-
Minimizes fuel burn and DOC.
-
Maximizes L/D ratio and overall efficiency.
-
Beyond this span, additional weight & cost outweigh benefits.
-
-
Airfoil Selection
-
Supercritical NACA 23015 with divergent trailing edge chosen:
-
Flatter upper surface + cambered trailing edge delays shockwaves.
-
Reduces wave drag, increases L/D ratio, improves fuel efficiency.
-
Validated by comparison to A320/B737 airfoil usage.
-
Spanwise twist added to delay tip stall and ensure even lift distribution.
-
Chord tapered toward tips to reduce induced drag and structural weight.
-
Thickness limited to 0.08 inches for manufacturability while housing fuel/gear.
-
-
Wing Sweep Optimization
-
Studied sweep configurations from straight wing up to 35–45°.
-
Optimal sweep = 25°, 27°, 35° (panels 1–3):
-
Low fuel burn (15,493 lbs)
-
Competitive DOC ($0.093/ASM)
-
High L/D ratio (17.11) & Oswald efficiency (0.9945)
-
Avoids low-speed handling and manufacturing issues from more extreme sweep.
-
-
Structural Analysis & Weight
-
Wing divided into 10 panels for structural analysis.
-
Final optimized wing weight = 14,666 lbf, close to ideal triangular load distribution.
-
Wing tip deflection = 34° at optimal sweep angle.
-
-
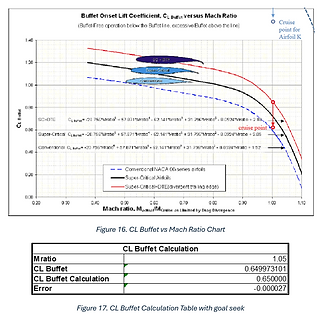
Buffet Margin & Performance
-
CL buffet checked with SC+DTE equation → cruise CL = 0.5, below buffet onset.
-
Mach ratio at cruise = 1.05 (safe margin for supercritical airfoil).
-
-
Wing Position & Dihedral
-
Dihedral angle = 4° (to satisfy wingtip clearance).
-
Wing located ahead of aerodynamic center for stability.
-
Mid/low-wing configuration selected for balance of stability, lift efficiency, and maintenance.
-
Landing gear retracts into fuselage without interference.
-
-
Drag Distribution
-
Drag highest at outer panels (1–8 increase, 9–10 slightly drop).
-
Suggests potential optimization by reshaping outer panels for more even drag distribution.
-
-
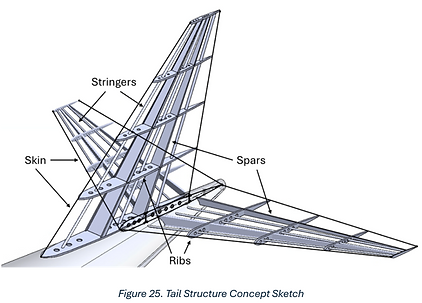
Wing Internal Structure
-
Built from spars (spanwise beams), ribs (airfoil shape), stringers (longitudinal support), and outer skin.
-
Houses fuel tanks, control linkages, hydraulic/electrical systems.
-
Spars contain lightening holes to reduce weight and allow routing of systems.
-
Design balances strength, weight, and aerodynamic integrity.
-
Tail Design
-
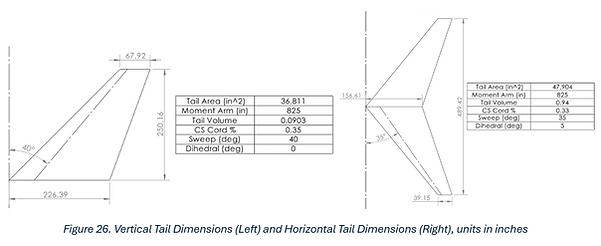
Horizontal Stabilizer
-
Mounted low on fuselage near tail.
-
Area: 47,904 in² | Span: 489 in.
-
Positioned behind center of gravity (CG) → provides leverage for pitch control & stability.
-
Tail arm length sized to maintain 10% static margin and meet horizontal tail volume coefficient.
-
Vertical placement keeps stabilizer clear of engine exhaust & reduces wing airflow interference.
-
Sized to ensure adequate pitch control in all flight conditions.
-
-
Vertical Stabilizer
-
Located at rear fuselage for yaw control and stability.
-
Ensures proper directional control during crosswinds and engine-out scenarios.
-
Vertical tail volume calculated as 0.0903 (above minimum limit of 0.04) → confirms proper sizing.
-
Designed to balance control authority, drag, and weight.
-
-
Center of Gravity (CG) & Stability
-
CG stays within forward/aft limits under all loading conditions (empty, payload, fuel).
-
Horizontal tail provides enough control force to keep aircraft trimmed.
-
Confirms wing and tail placement allow proper balance and controllability.
-
-
Empennage Structure & Control Surfaces
-
Empennage includes:
-
Vertical stabilizer + rudder (yaw control).
-
Horizontal stabilizer + elevator (pitch control).
-
-
Internal structure: spars, ribs, stringers supporting outer skin (strong yet lightweight).
-
Control surfaces actuated by hydraulic/electric systems.
-
Designed to withstand flight loads while minimizing weight.
-


System Design
-
Nose Landing Gear
-
Located just behind radome to leave space for radar equipment.
-
Attached to forward bulkhead for structural support.
-
Strut design: as short as possible while meeting clearance requirements.
-
Minimum pitch rotation: 10° (12° with extended strut).
-
Minimum roll clearance: 9°.
-
-
Supports ≥ 4% of aircraft total weight.
-
Tire dimensions:
-
Diameter = 0.44D | Width = 0.39D | Loaded radius = 0.41D.
-
Operating pressure up to 190 psi.
-
-
Uses two tires (not one) → better weight distribution, steering stability, reduced runway stress, redundancy in case of tire failure.
-
-
Main Landing Gear
-
Dual-strut configuration, each with four tires for load distribution.
-
Tire spacing satisfies:
-
Δx ≥ 1.1D (lateral spacing).
-
Δy ≥ 1.14D (longitudinal spacing).
-
-
Mounted on rear wing spar for efficient load transfer.
-
Retracted position lies between rear spar and flap region to avoid interference.
-
Positioned to maintain:
-
≥ 4% static nose gear load.
-
Tip back angle > 15°.
-
Outside 45° tip over line from CG.
-
-
Gear length chosen for:
-
Proper ground clearance during full bank and takeoff rotation.
-
Minimum structural weight and retraction complexity.
-
-
Wheels retract aft of rear spar, staying within lower fuselage profile for aerodynamic efficiency and packaging constraints.
-
Propulsion Design
-
Engine Type Selection
-
Turbofan engine chosen for mission profile (Mach 0.8, 36,000 ft).
-
Advantages over turboprops:
-
High efficiency at high subsonic cruise speeds.
-
Better fuel economy, quieter operation, lower drag.
-
Faster climb rates and shorter flight times.
-
Avoids long landing gear required for large propellers → less weight and complexity.
-
-
Decision based on cruise performance, fuel burn, noise, and integration challenges.
-
-
Engine Placement
-
Longitudinal: Nozzle centerline aligned with wing leading edge → reduces aerodynamic interference and pylon weight.
-
Lateral: Mounted close to fuselage → reduces yaw moment during engine-out and allows smaller vertical tail, while avoiding wake ingestion.
-
Vertical: Mounted below wing, not protruding above it → minimizes transonic drag, ensures ground clearance under max bank and landing roll.
-
Placement avoids jetwash impact on tail/landing gear, satisfying safety and clearance requirements.
-
-
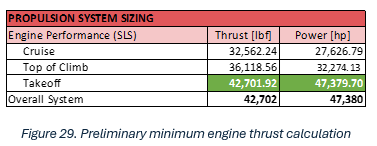
Thrust Sizing
-
Minimum thrust determined using propulsion sizer model (Lab 7).
-
Inputs: MTOGW, TOFL (shortest runway on route), cruise Mach/altitude, max landing approach speed (145 knots at MLW).
-
Takeoff segment required highest thrust: ≈ 42,700 lbs.
-
-
Engine Configuration
-
Two-engine layout chosen:
-
Matches comparable aircraft (A320, 737).
-
Provides sufficient thrust with lower fuel burn, maintenance, and weight than four engines.
-
Meets regulatory and operational requirements for short/medium-haul missions.
-
-
Fan Diameter Optimization
-
Trade study determined optimal fan diameter = 75 inches:
-
Low fuel burn: 15,342 lbs.
-
Low DOC: $0.0923 (near minimum).
-
High ideal efficiency: 0.87.
-
Manageable nacelle drag (0.97 ft²), pod weight (17,773 lb), and landing gear weight (12,054 lb).
-
Avoids sharp weight/drag penalties beyond 80-inch diameter.
-
-
Balances performance, efficiency, and structural/aerodynamic impacts.
-


Mission Performance
-
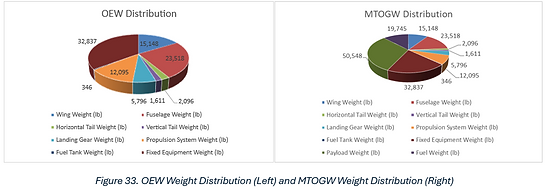
Weight Distribution
-
OEW (Operating Empty Weight):
-
Heaviest components: propulsion system (12,095 lb), fuselage (23,518 lb).
-
Fuselage, wings, and landing gear make up substantial portions of OEW.
-
-
MTOGW (Maximum Takeoff Gross Weight):
-
Includes payload (50,548 lb) and fuel weight (19,745 lb).
-
Payload and fuel are the primary contributors to weight increase over OEW.
-
-
-
Operating & Total Costs
-
Direct Operating Cost (DOC):
-
Fuel & oil = 35%, maintenance = 28%, flight crew = 16%.
-
-
CAROC (Cash Airline Required Operating Cost):
-
Fuel & oil = 48%, flight crew = 22%, navigation fees = 15%.
-
-
Total Airline Cost (TOC):
-
Indirect costs = 27% (largest), fuel = 25%, maintenance = 20%, flight crew = 12%.
-
-
Inputs & assumptions:
-
Fuel price = $3.00/gal + $0.50 tax.
-
Airframe cost = $720/lb, engine core = $2400/lb, non-core = $1200/lb, avionics = $5M.
-
6% interest, 20-year repayment, $750/block hr per pilot, $100/block hr per cabin crew.
-
Maintenance = $1000/block hr × √(OEW/150,000 lb), insurance = 11% of ownership cost per nm.
-
-
-
Aircraft Drag Breakdown
-
Wing = 29.7%, nacelle = 27.6%, fuselage = 26.1% → >80% total drag combined.
-
Horizontal tail = 6.6%, vertical tail = 3.3%, misc. components = 2.2%.
-
Focus for aerodynamic improvement: wing, nacelle, fuselage.
-
-
Cruise Speed & Altitude Selection
-
Selected cruise altitude = 36,000 ft (typical for A320/737, meets >31,000 ft requirement).
-
Critical Mach ≈ 0.8 for NACA 23015 → above this, drag rises rapidly (shock waves).
-
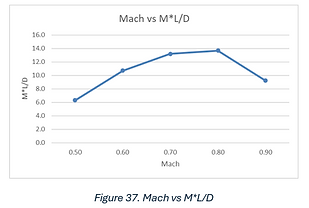
Mach vs L/D:
-
Peak L/D = 18.84 at Mach 0.70 (best aerodynamic efficiency).
-
L/D drops at Mach 0.80 (17.11) and Mach 0.90 (10.26).
-
Mach vs M×L/D:
-
Peak ML/D = 13.7 at Mach 0.80 → best overall cruise efficiency.
-
Cruise Mach selected = 0.80.
-
-
Fuel Breakdown
-
Largest portion: reserved fuel = 4314 lb (safety margin).
-
Cruise segments dominate fuel consumption (1277–1389 lb per segment).
-
Taxi, acceleration, climb use comparatively less fuel.
-
-
High-Lift Devices & Field Performance
-
Chosen configuration: 65% span double-slotted flaps + slats.
-
Reduces stall speed → shortens TOFL and lowers landing speed.
-
Clmax = 3.47 → supports safe takeoff/landing performance.
-
Matches baseline DOC ($0.093/asm) → no cost penalty.
-
OEW = 93,446 lb → moderate structural weight.
-
-
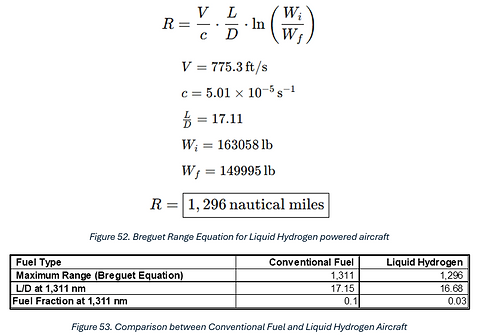
Range Calculations
-
Jetsizer range: 1347 nm vs. Breguet equation: 1311 nm.
-
Difference due to Jetsizer’s segmented cruise modeling vs. Breguet’s continuous approximation.
-
Jetsizer tracks changing fuel burn/weight for more accurate results.
-
-
DOC Optimization
-
Wingspan: 1500 in → near DOC minimum.
-
Fan diameter: 75 in → optimal efficiency vs. drag/weight penalties.
-
Sweep angles: [25°, 27°, 35°] → balance of low DOC, good handling, manufacturability.
-
High-lift configuration chosen to minimize DOC while maintaining performance.
-
-
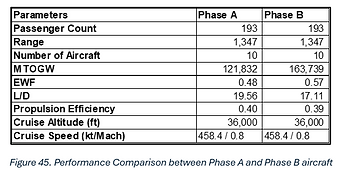
Phase A vs. Phase B Differences
-
Higher MTOGW and 9% higher EWF (more detailed weight breakdown).
-
Slightly lower L/D due to realistic sweep angles and convergence corrections.
-
Propulsion efficiency within 1% of Phase A (minor convergence errors).
-
Design Space Studies
-
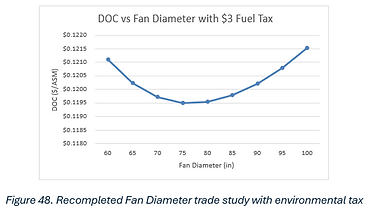
Fan Diameter Trade Study
-
DOC shifts upward to ~$0.12/ASM with added $3 environmental fuel tax.
-
Optimal fan diameter remains 75 in, confirming original design choice.
-
-
Cruise Speed vs. Specific Range
-
Peak specific range at 401 knots → 0.096 nm/lb fuel.
-
Specific range decreases at slower/faster speeds → 400 knots is optimal cruise regime.
-
-
Materials Trade Study
-
Composites: Lowest OEW (93,446 lb) & fuel burn (15,431 lb) but highest DOC ($0.0927/ASM).
-
Aluminum: Highest OEW & fuel burn but lowest DOC ($0.0902/ASM).
-
Al-Li: Middle ground for weight and fuel efficiency, slightly higher DOC than aluminum.
-
Shows trade-off between weight savings vs. manufacturing/material costs.
-
-
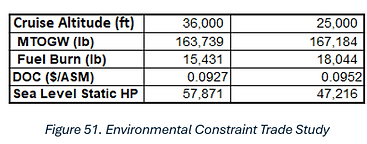
Cruise Altitude Trade Study
-
Lowering altitude from 36,000 ft → 25,000 ft:
-
Fuel burn ↑ from 15,431 lb to 18,044 lb.
-
DOC ↑ from $0.0927 to $0.0952/ASM.
-
MTOW ↑ → more fuel needed to complete mission.
-
Engines work harder in denser air → reduced efficiency and higher drag.
-
-
-
Liquid Hydrogen Range Analysis
-
Used Breguet Range Equation with hydrogen’s higher specific fuel energy.
-
Inputs kept constant (drag, weight) for comparison.
-
Real-world hydrogen aircraft would be heavier due to:
-
Larger fuselage (to fit passengers + hydrogen tanks).
-
Heavier systems & structure → lower effective L/D and fuel fraction.
-
-
-
Electric Propulsion Range Analysis
-
Propulsion efficiency assumed = 0.7 (conservative).
-
Electric aircraft range far shorter than jet fuel aircraft due to low battery energy density.
-
Electric systems better suited for short flights, conventional fuel needed for long-haul.
-
-
20% Range Increase
-
Wing size unchanged (still 1,500 in) → enough volume for extra fuel.
-
MTOW ↑ from 163,739 lb → 167,393 lb.
-
Fuel burn ↑ from 15,431 lb → 18,361 lb.
-
DOC ↓ from $0.0927 → $0.0906 → aircraft becomes slightly more cost-efficient.
-
-
ICAO Code C Constraint
-
Current wingspan = 38.1 m → exceeds Code C (24–36 m).
-
Reducing wingspan by 30 ft (360 in) → meets Code C, allows more airport compatibility.
-
Trade-off:
-
Longer wing: Higher L/D → better range & efficiency, but limited airport access.
-
Shorter wing: Lower L/D, less fuel volume, shorter range → but greater airport compatibility.
-


Summary & Conclusion
-
Phase B Design Overview
-
Refined conceptual design from Phase A with more accurate performance metrics.
-
EWF: Increased from 0.48 → 0.57 (better structural weight estimates).
-
Propulsion Efficiency: Slightly decreased from 0.40 → 0.39 (more detailed engine model).
-
L/D Ratio: Dropped from 19.56 → 17.11.
-
Cruise Mach & Altitude: Remained constant at Mach 0.8, 36,000 ft.
-
DOC: Improved from $0.12 → $0.09 due to optimized design choices (materials & aerodynamics).
-
-
Design Strengths
-
Balanced wing design, engine selection, and material choice improved cost efficiency.
-
Maintained strong performance despite increased EWF and reduced propulsion efficiency.
-
DOC improvement demonstrates success of optimization process.
-
-
Limitations
-
Relied on idealized aerodynamic assumptions and simplified structural models.
-
Real-world performance may differ.
-
-
Recommendations for Future Work
-
Reduce structural weight without compromising safety.
-
Explore advanced composite materials to improve EWF.
-
Refine engine design for higher propulsion efficiency.
-
Conduct additional trade studies (wing aerodynamics, high-lift devices, weight-saving methods).
-
Perform sensitivity analysis on DOC to account for changing fuel prices and operating costs.
-
References
-
Bradley, M. (2025). Technology Extrapolation V2 [Lecture slides]. University course materials.
-
Bradley, M., Lazzara, D., & Byahut, S. (2025, March 10). 2025 AME 481 project kick off v1 [PDF document]. University of Southern California.
-
International Council on Clean Transportation. (2022, July). Performance Analysis of Regional Electric Aircraft [White paper]. https://theicct.org/wp-content/uploads/2022/07/global-aviation-performance-analysis-regional-electric-aircraft-jul22-1.pdf-1.pdf
-
Lazzara, D., & Hoisington, Z. (n.d.). Lazzara High Speed Aerodynamics [Presentation slides]. https://www.researchgate.net/figure/De-Laval-nozzle-the-flow-is-constantly-and-smoothly-accelerated-all-along-the-duct-from_fig2_348294662
-
Massachusetts Institute of Technology. (2021). Unified Engineering: Materials and Structures Lecture Notes. MIT OpenCourseWare. https://ocw.mit.edu/courses/16-001-unified-engineering-materials-and-structures-fall-2021/mit16_001_f21_lec_driver_art.pdf
-
Rawdon, B. (n.d.). Rawdon’s Configuration Layout [PDF document]. University of Southern California, AME-481.
-
Rawdon, B. (2024, January). Rawdon Cross Section and Interior Arrangement [PDF document]. University of Southern California, AME-481.
-
Raymer, D. P. (2024). Aircraft design: A conceptual approach (7th ed.). American Institute of Aeronautics and Astronautics. Available from VitalSource Bookshelf.
-
SeaRates. (n.d.). ULD LD3 container specifications. https://www.searates.com/reference/uld/ld3/
-
Skybrary. (n.d.). ICAO Aerodrome Reference Code. https://skybrary.aero/articles/icao-aerodrome-reference-code
-
University of Southern California, Department of Aerospace & Mechanical Engineering. (2025). Lab 10 Unique Trade Studies [Course lab assignment].
-
University of Southern California, Department of Aerospace & Mechanical Engineering. (2025). Lab 7 Impact of High Lift Systems [Course lab assignment].
-
University of Southern California, Department of Aerospace and Mechanical Engineering. (2025). USC AME 481 Aircraft Design Project – Phase B (Spring 2025, 3/6/2025 version). University of Southern California.